There are 4 basic options for dealing with height values in Google Earth. KML vector data can be clamped to the ground (all data lays directly on the ground with no height values used), data can be extruded relative to the ground (a height value of 5 meters will be extruded 5 meters above the ground at any given location), or height can have an absolute value (height is the actual height regardless of the underlying terrain; a point with a height of 5010 meters at a location with a height of 5000 meters will be 10 meters above the ground).
The fourth option for height uses the above options by applies to Collada models that can be loaded in Google Earth after Version 4. Models are not available in Shape2Earth 1.0, but may be made available later.
 For this very simple example, we will select Relative To Ground as our height mode. When this is selected, the other 3D options in Shape2Earth are made available.
The first choice we will need to make is the unit to be used for height. The options given are Feet or Meters. For this example, we will select Feet.
(Note: All height units in KML are measured in meters. The Feet option in Shape2Earth converts to a metric equivalent for Google Earth)
 There are three different ways in Shape2Earth to get height values. You can use an attribute field in the GIS attribute data to use as a height, you can set a single arbitrary height that will be applied to all features, or you can use Z values in the GIS data itself (if they are present).
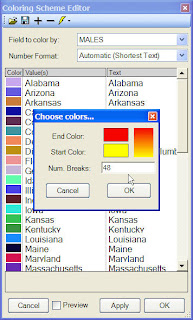
For this example, we are going to select an attribute field to use for height. The field selected was MALES (see below).
 Once we have set all selections for height, we can convert the data to KML and view it in Google Earth (below).
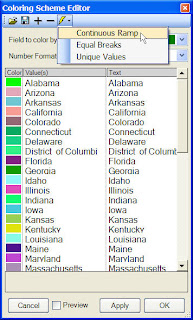
To make a more powerful map, we can associate the color of each State with the height. To do this, we will open the properties of the shapefile (right-click in the MapWindow table of contents and select 'Properties'), and then open the Coloring Scheme Editor (refer to Changing Polygon Colors for more information on changing colors)
Once the Coloring Scheme Editor is open, select STATE_NAME as the Field to color by, and select Continuous Ramp (see below).
 Next, you will be given a form to select the beginning and ending color that will be used to color ramp between the high and low value. For this example, I have chosen Red for the end color (high value) and yellow for the start color (low value).
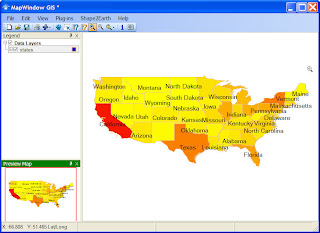
 The graphic below shows the color ramp applied to the data as seen in MapWindow.
And the graphic below shows this color scheme with the height values in Google Earth.
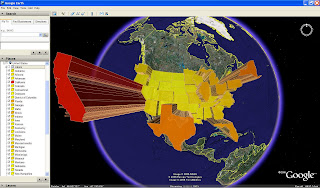
The graphic below is the same as above with the opacity level set to 100% (instead of 80% above).
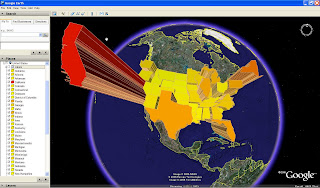
While this map does convey information pretty well, there are a couple of problems with it. For one, California is so high that it becomes difficult to see the other States. In situations like this, it might be a good idea to normalize your GIS data. Fortunately, there are a number of methods for normalizing data that can be done rather easily in MapWindow. (Refer to Normalizing GIS Data For Google Earth to learn how).
Return to Users Manual
 Next, you will be given a form to select the beginning and ending color that will be used to color ramp between the high and low value. For this example, I have chosen Red for the end color (high value) and yellow for the start color (low value).
 The graphic below shows the color ramp applied to the data as seen in MapWindow.
And the graphic below shows this color scheme with the height values in Google Earth.

The graphic below is the same as above with the opacity level set to 100% (instead of 80% above).

While this map does convey information pretty well, there are a couple of problems with it. For one, California is so high that it becomes difficult to see the other States. In situations like this, it might be a good idea to normalize your GIS data. Fortunately, there are a number of methods for normalizing data that can be done rather easily in MapWindow. (Refer to Normalizing GIS Data For Google Earth to learn how).
Return to Users Manual
No comments:
Post a Comment