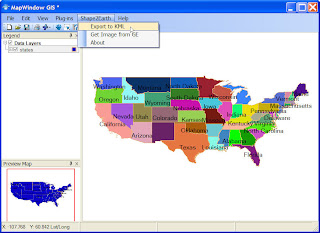
Is this example, we have already loaded the states.shp shapefile and have given each state a unique color. Once we have done this, we can launch Shape2Earth.
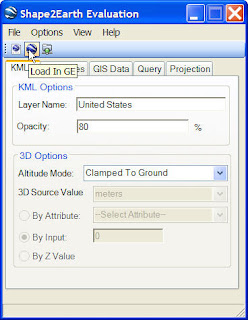
 In the Shape2Earth KML tab, the Layer Name defaults to the name of the shapefile. We can change this name to anything we want (such as the change to "United States" below). We can also change the opacity of the features to any number between 0 and 100 (with 100 being fully opaque and zero being invisible). You can play with this number to see what looks best, but for this example, we will set it to 80%.
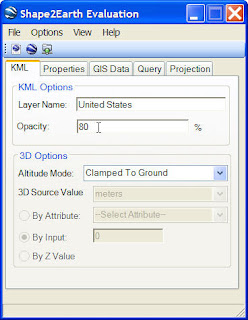
We will leave the 3D options as they are so that each State wil lay directly on the surface of Google Earth.
Next, click on the GIS Data tab. Select the STATE_NAME field from the drop-down box next to Feature Name Field. This will be the name of each of our features in Google Earth. Then, click on the Order by Feature Name check box. This will sort all of the features so that they will be seen in alphabetical order in Google Earths table of contents.
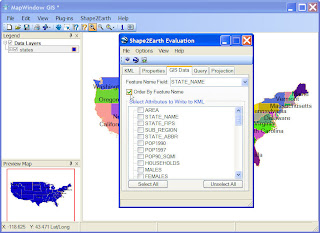
Next, we can decide which GIS attributes we would like to see in the KML document in Google Earth. The selected attributes (see checked boxes below) are written into the KML description tag as an HTML table, and are seen in the Google Earth balloons that pop-up when a feature is selected.
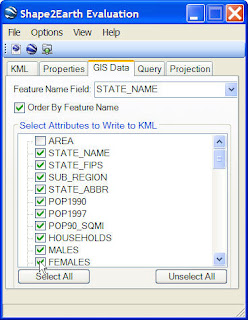
Once we have set all of our options, we can either save as KML, or save as KML and immediately load the saved KML file into Google Earth (see graphic below).
When creating polyons, the GIS attribute data that we emedded in the KML can be made visible in a couple of ways. You can click on the feature in the table of contents, you can hold down the Ctrl key and click on the polygon, or you can make a centerpoint label for each polygon that can be clicked on to open the balloon.
The method for creating centerpoints is described HERE, and was used to create the graphic seen below.
Also note that the names of each state have been writtein in alphabetical order, and are listed in that order in the table of contents (see below). This option is very helpful when trying to find a specific feature by name.
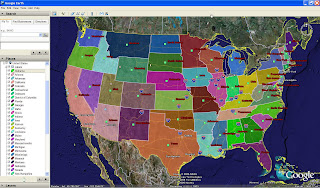
This KML file was created using the centerpoint option. This option created a point that acts as a label and a selection point to view the information balloon. This option also let us set our own rollover option. This option lets the user change the icon and label when a viewer hovers over a point (see below).


1 comment:
Hi, I am new to MapWindow and to the process of converting shp to KML. I just tried to convert a file (Beijing area) into KML, but when I ivew the KML file in GE, I noticed that the longitute is off. Is there any way to correct the problem? Or did I do something wrong? I did not make the sph file, so it's hard me to know whether the original data itself is problematic, or whther the conversion process causesd the offset. Any suggestions? Thanks.
Post a Comment