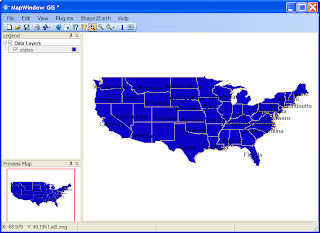
We will start out with a basic shapefile loaded into MapWindow. When loaded MapWindow sets a default color for the shapefile. In the case below, the default was blue. If you are following along with MapWindow, your color might be different.
(Note: the shapefile used in this exercise is from the MapWindow installation, usually found at C:\Program Files\MapWindow\Sample Projects\United States\Shapefiles\states.shp).

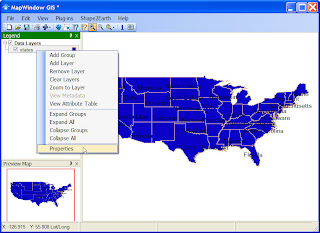
To change the color of the polygons, right-click on the shapefile name in the MapWindow table of contents and select Properties from the menu.

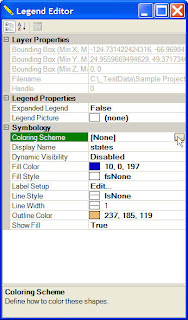
This will open up the MapWindow Legend Editor for the selected shapefile. The Legend Editor presents several options for changing the shapefile symbols. You can change both the Fill Color and the Line Color for the shapefile to get the color scheme you want. You can also set the colors of each individual feature based on a GIS attribute. This will allow you to create highly customizable GIS based maps for displaying in Google Earth.
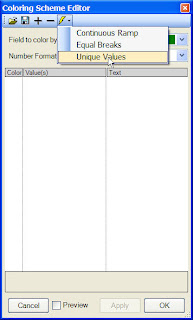
 To set the color of each feature based on a GIS attribute, click on the Coloring Scheme value in the Legend Editor (see above). This will open up the Coloring Scheme Editor (below). The first thing you will need to do is to select the GIS attribute field whose values you would like to use for color coding. In this example, we are going to use the STATE_NAME field to uniquely color code each State.
Once you have selected the field you want to use, you will need to determine how you want to break up the data in that field to be color coded. MapWindow offers 3 options for cartagraphically organizing and displaying data using color.
You can use Continuous Ramp to make a smooth transition from one color to another based on attribute values. Any example of this method is shown HERE.
Equal Breaks allows users to organize data into specific color categories based on their attribute relationships.
Unique Values sets a color for each unique value. This is what we will use for this example.

After you have selected Unique Value, the Coloring Scheme Editor will be populated by the unique values found in the selected attribute field, and will apply a random color to each unique value (see below).

Each individual color can me modified by the user simply by clicking on it. This will open the Color Editor which is used for selecting a cusomized color. In the example below, we are changing the color of the unique value 'Alabama' from Black to Green.
Select a new color or define a custome one.
This process will change the colors of the data as seen in MapWindow below. These color schemes are what will be used by Shape2Earth to color code the KML data for viewing in Google Earth.


No comments:
Post a Comment